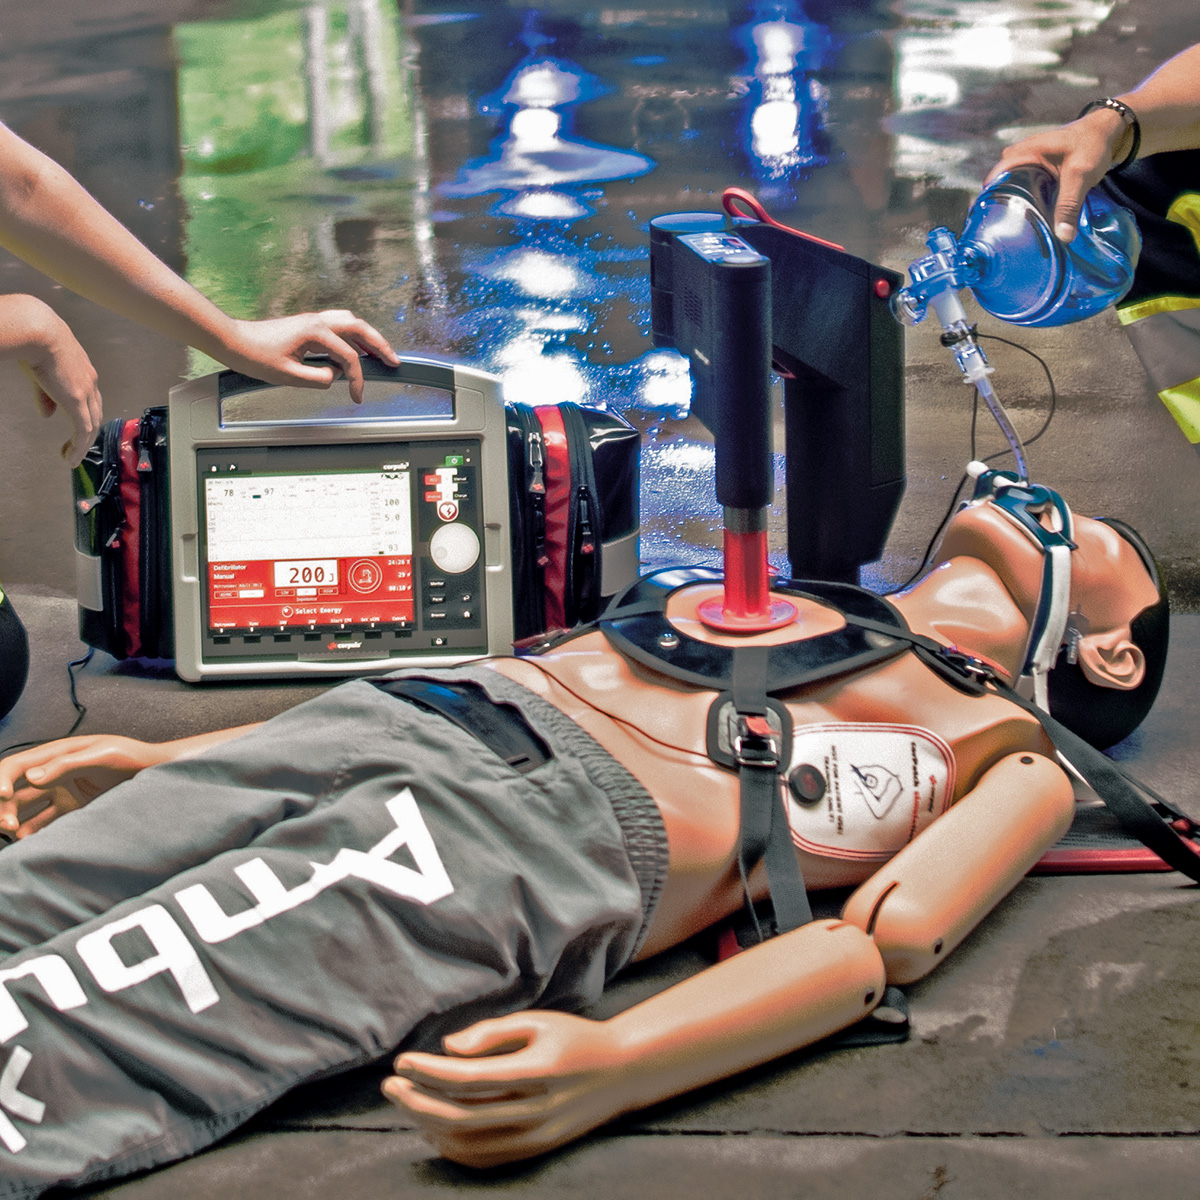
The corpuls revolution of the ECG.
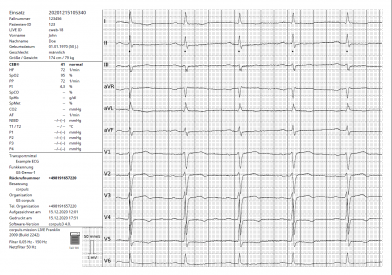
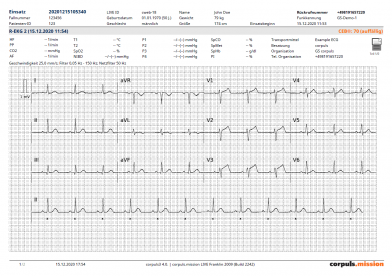
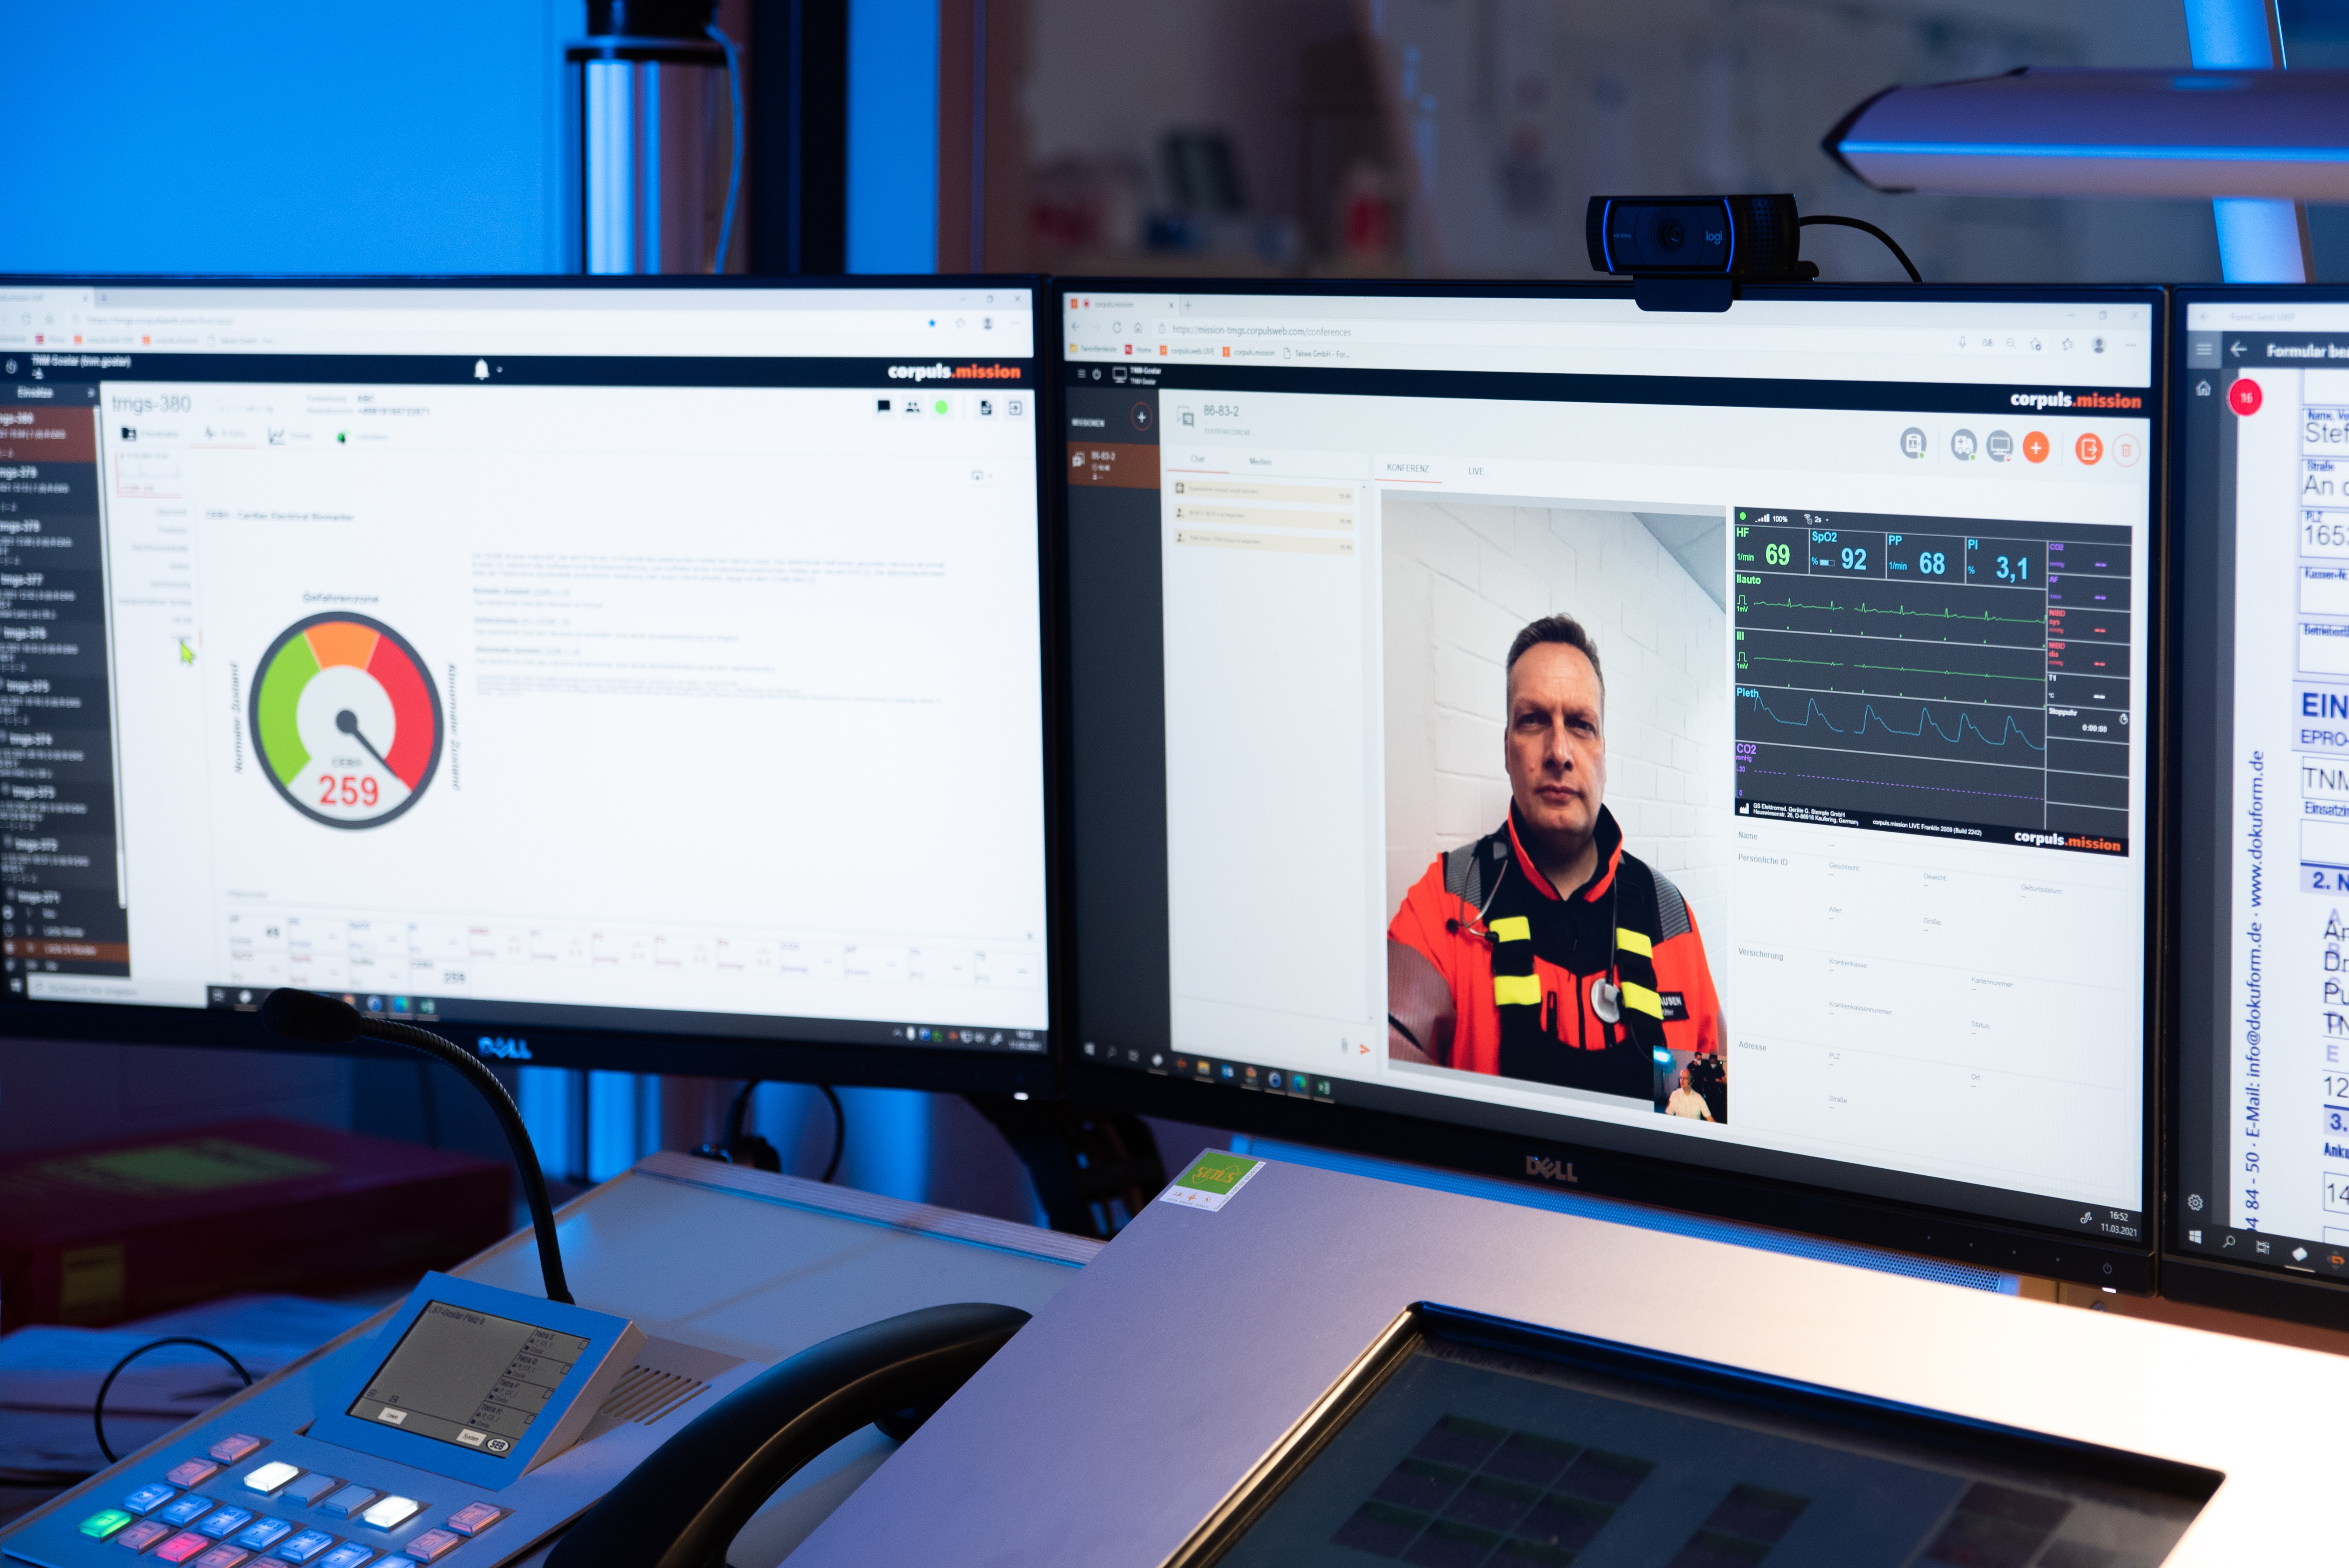
With the ECGmax, you don't have to settle for the typical 12-leads. You get a generous 22-leads – that's ten additional real-time views of cardiac electrical activity, providing a more detailed, comprehensive picture of the patient's condition. The current guidelines of the European Society of Cardiology (ESC) call for examination of the extended posterior V7-V9 leads and the right-sided ventricular V3r-V6r leads. No additional effort is required and no electrodes need to be attached or repositioned. Any additional lead is calculated on the server and can be displayed or measured in corpuls.mission as well as forwarded as a PDF attachment via e-mail or fax over the corpuls gateway.
Watch the video to learn more

The corpuls.science brochure offers clinical observations and published scientific data in relation to the ECG. Among other things, it shows basic information about the ACS algorithm or signal filtering of an ECG in a concise, insightful manner. At the same time, it offers a wide variety of research articles to promote clinical accuracy and effective diagnostic use of the calculated 22-lead ECG, the vector loops and the CEB®.
ECGmax
Benefits include:
• Advanced 22-lead diagnostics.
• Posterior leads V7–V9.
• Right-sided ventricular leads V3r–V6r.
• Orthogonal leads x,y and z and associated vector loops.
• Only 10 electrodes, extremities and chest leads.
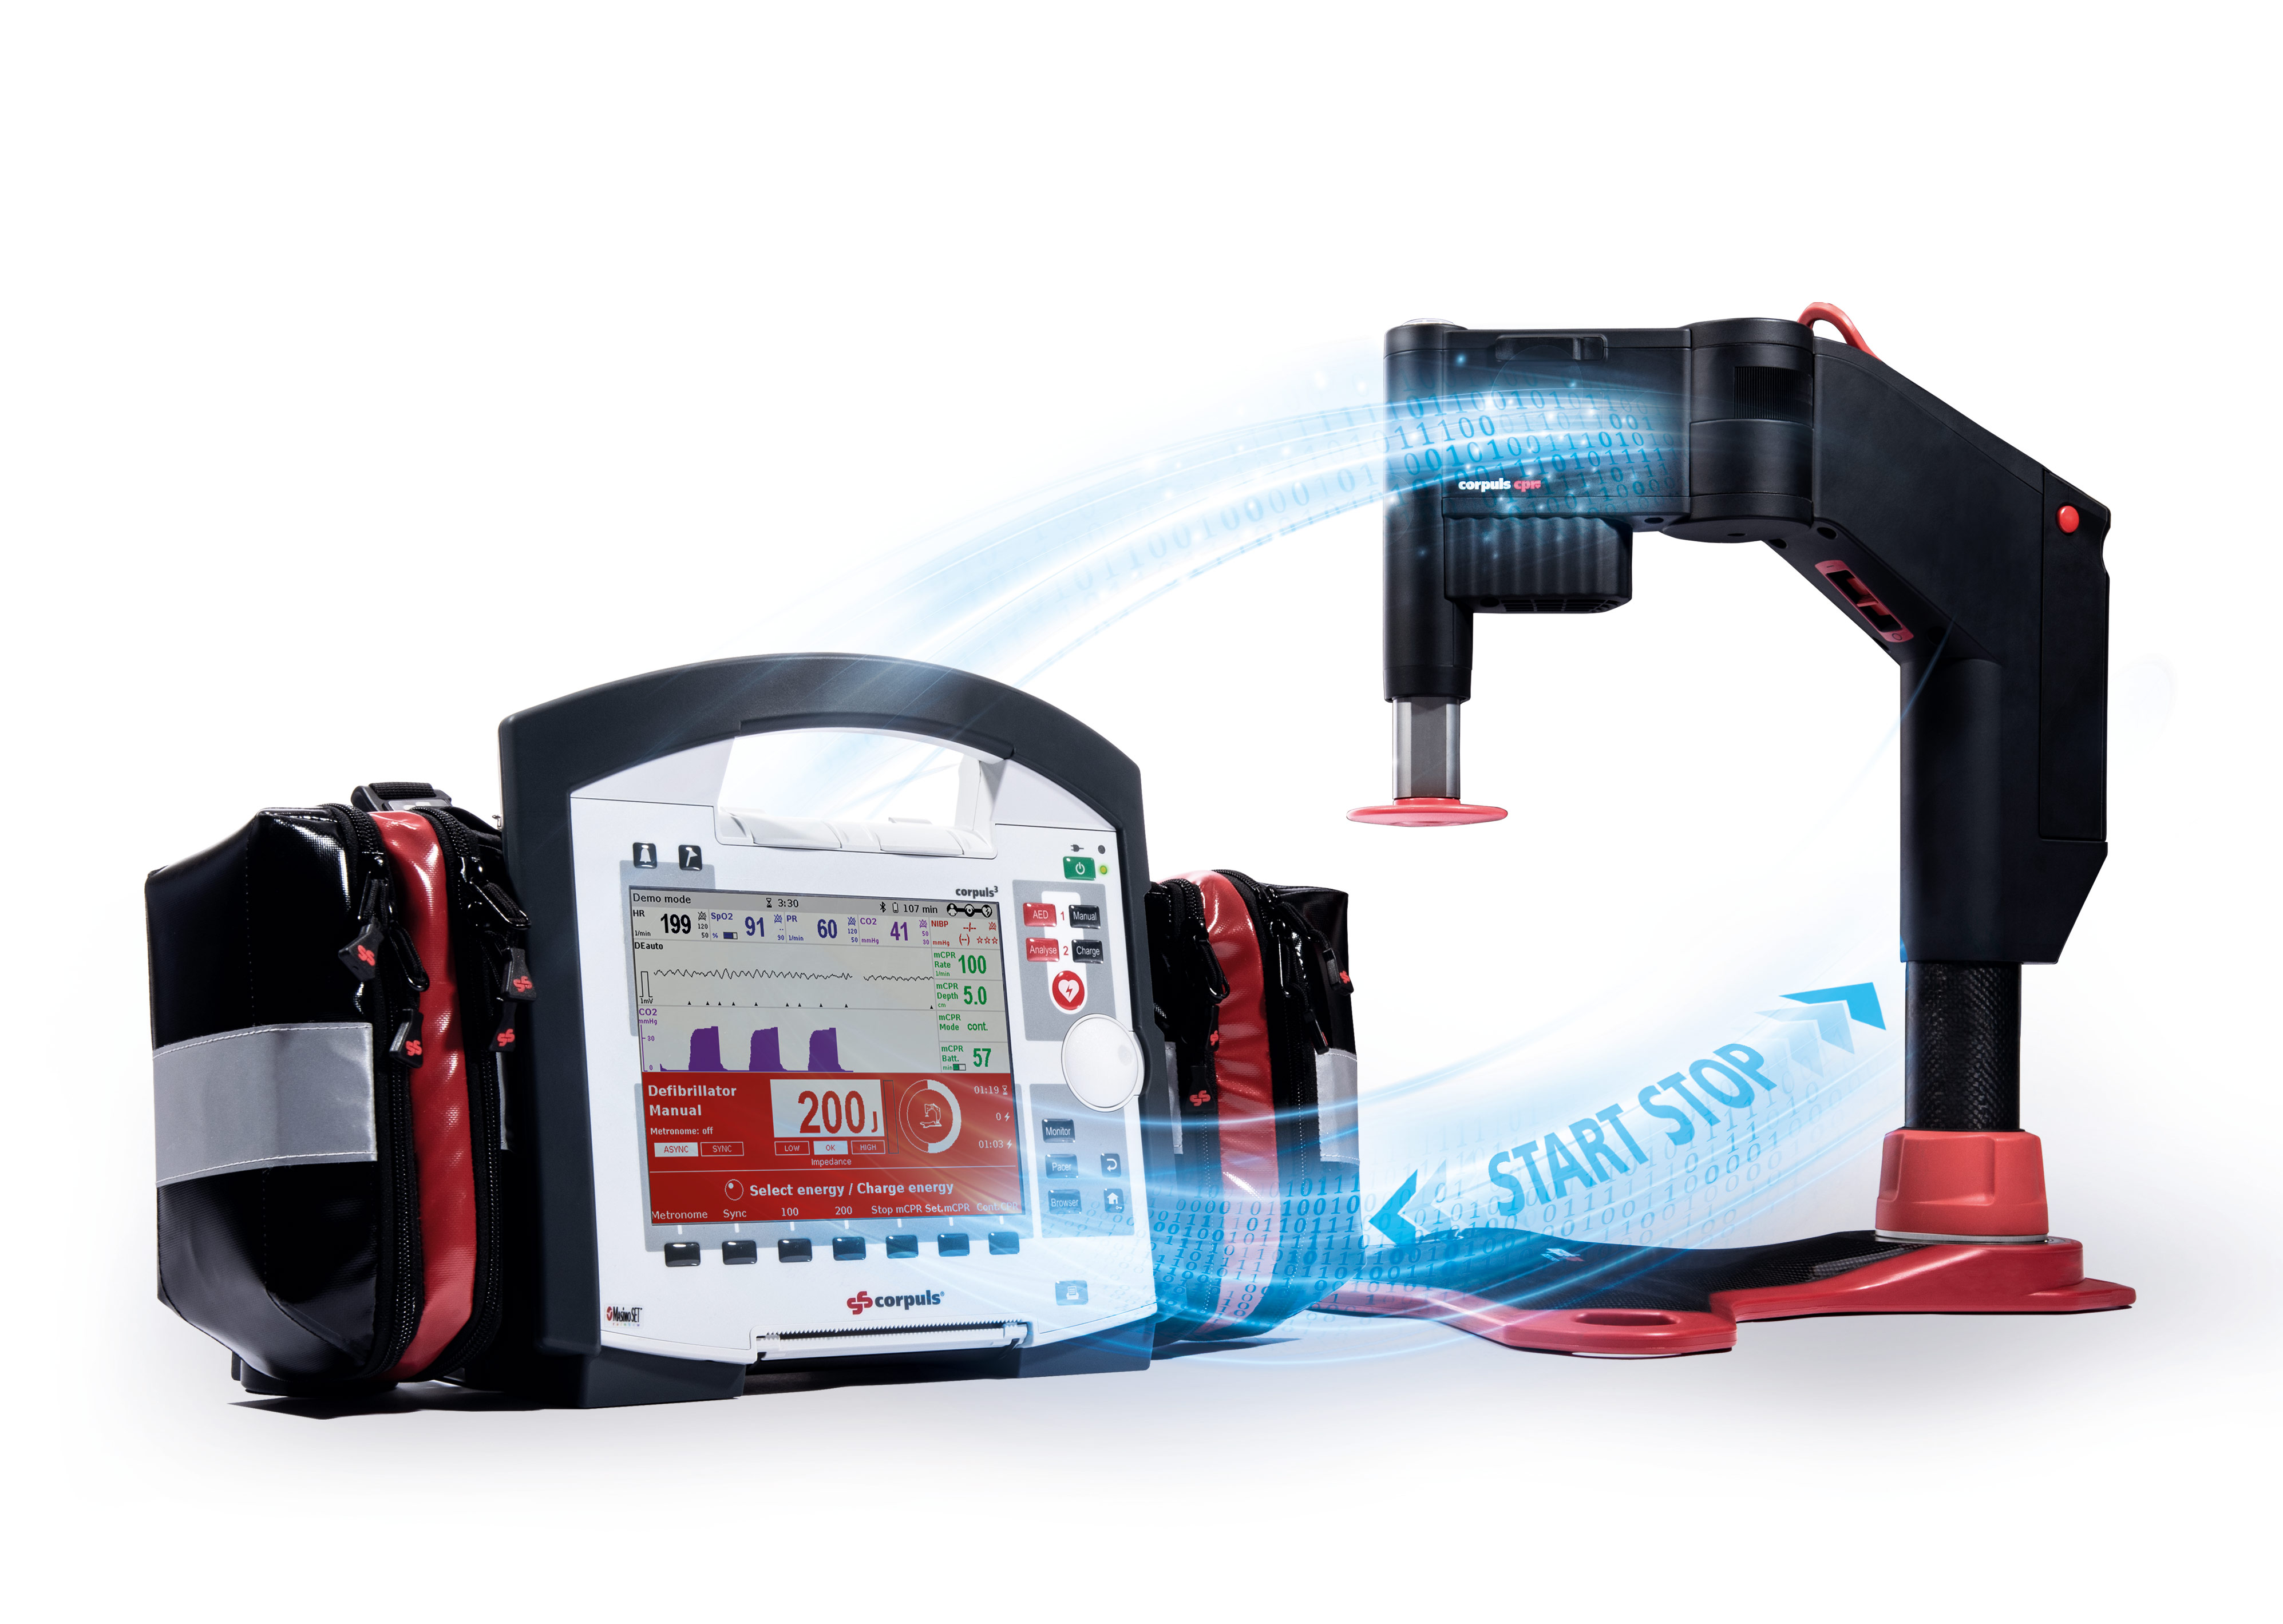
• Displays on any corpuls3 with the telemetry option.
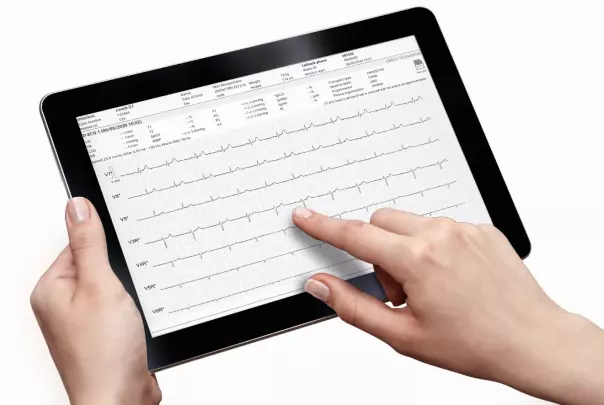
VECTORCARDIOGRAPHY
Vectorloops according to Frank, consider the electrical conduction in the heart as a rotating dipole. The course of the peak of this vector is spatially represented as a loop in a three-dimensional individual coordinate system. The loops correspond to the P wave, the QRS complex and the T wave. With a healthy myocardium, the loops are regular and "fluid looking", with a dysfunction the conduction of the dipole is rather irregular and jagged.
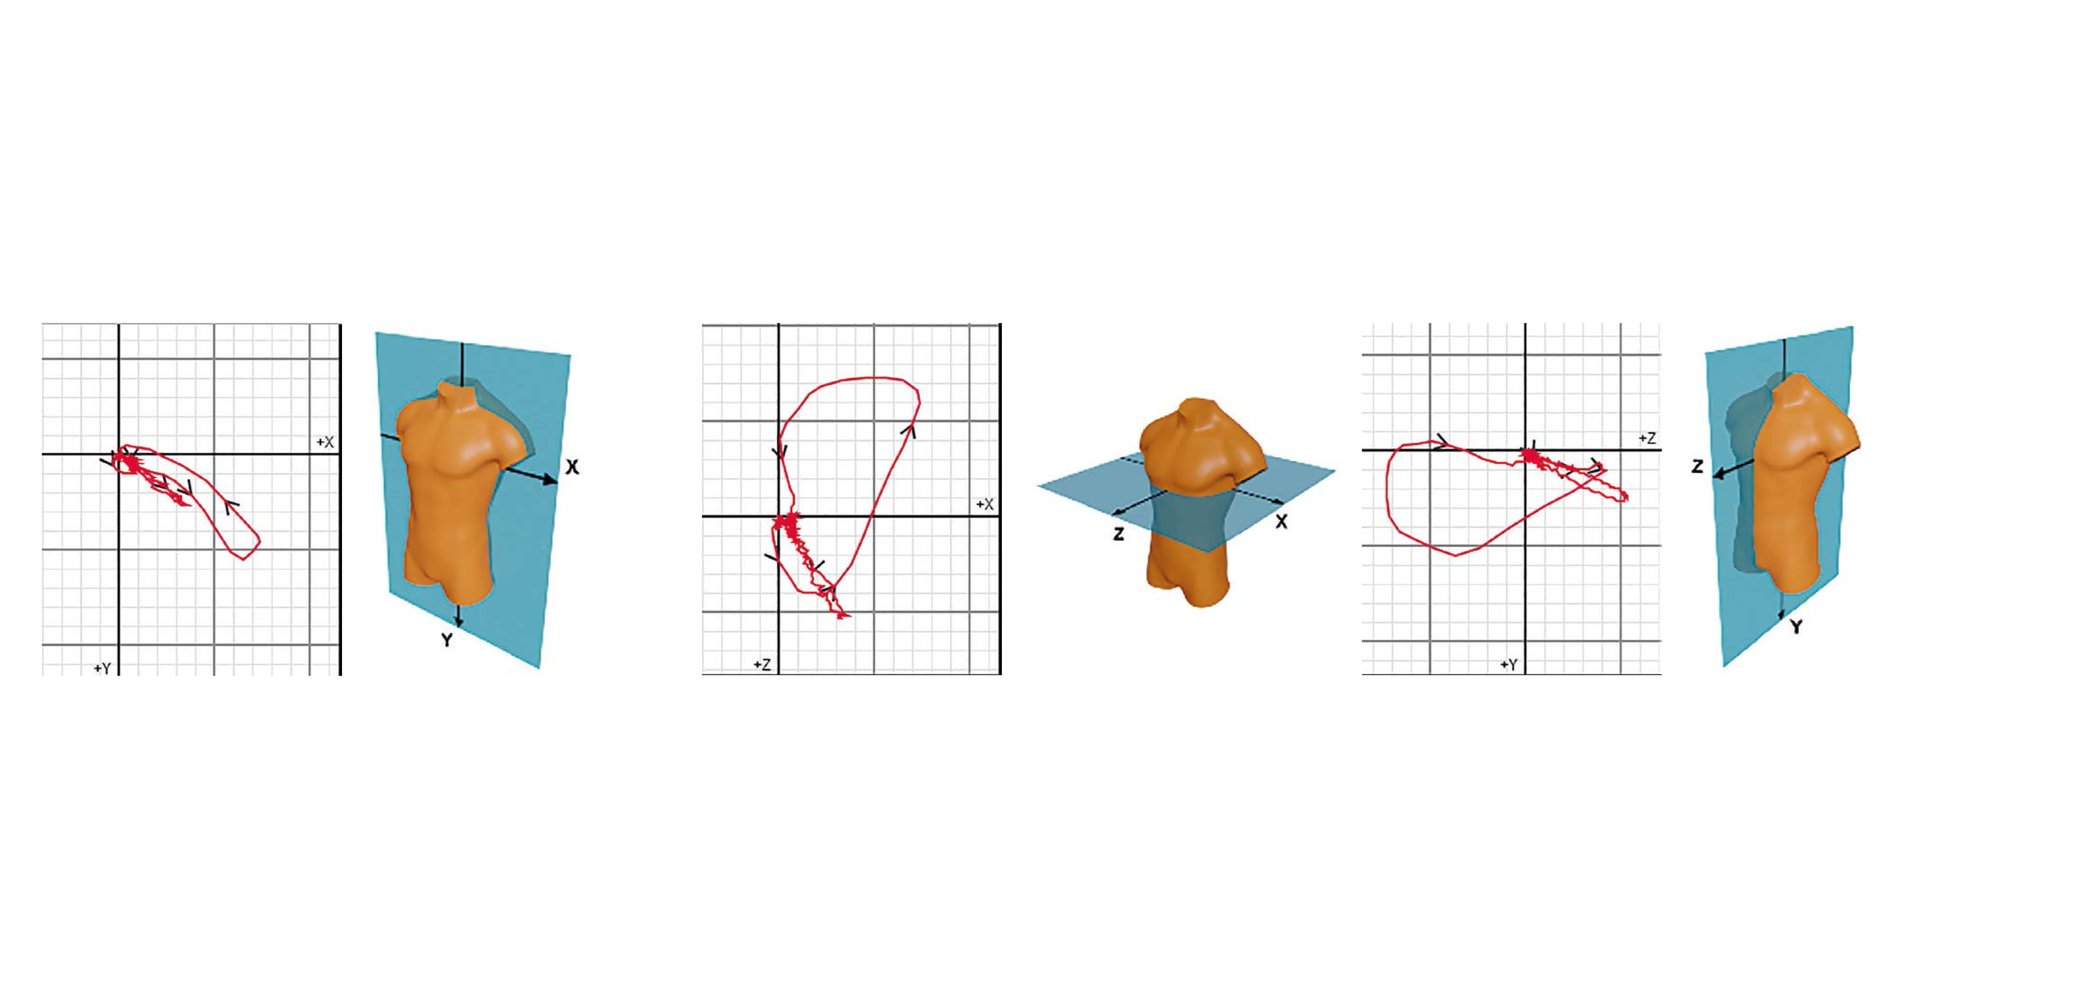
• Electrical signal propagation considered as a rotating dipole.
• Represented as loops in the coordinate system.
• The loops correspond to the P wave, QRS complex and T wave.
• Physiological loops appear homogenous and fluid.
• Pathological loops appear jagged and irregular.
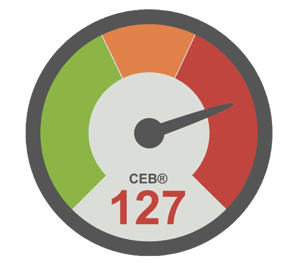
CEB®
The Cardiac Electrical Biomarker
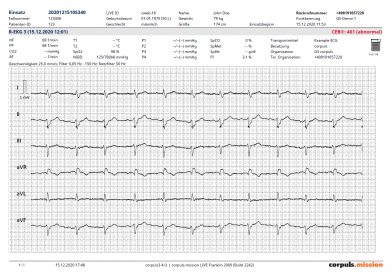
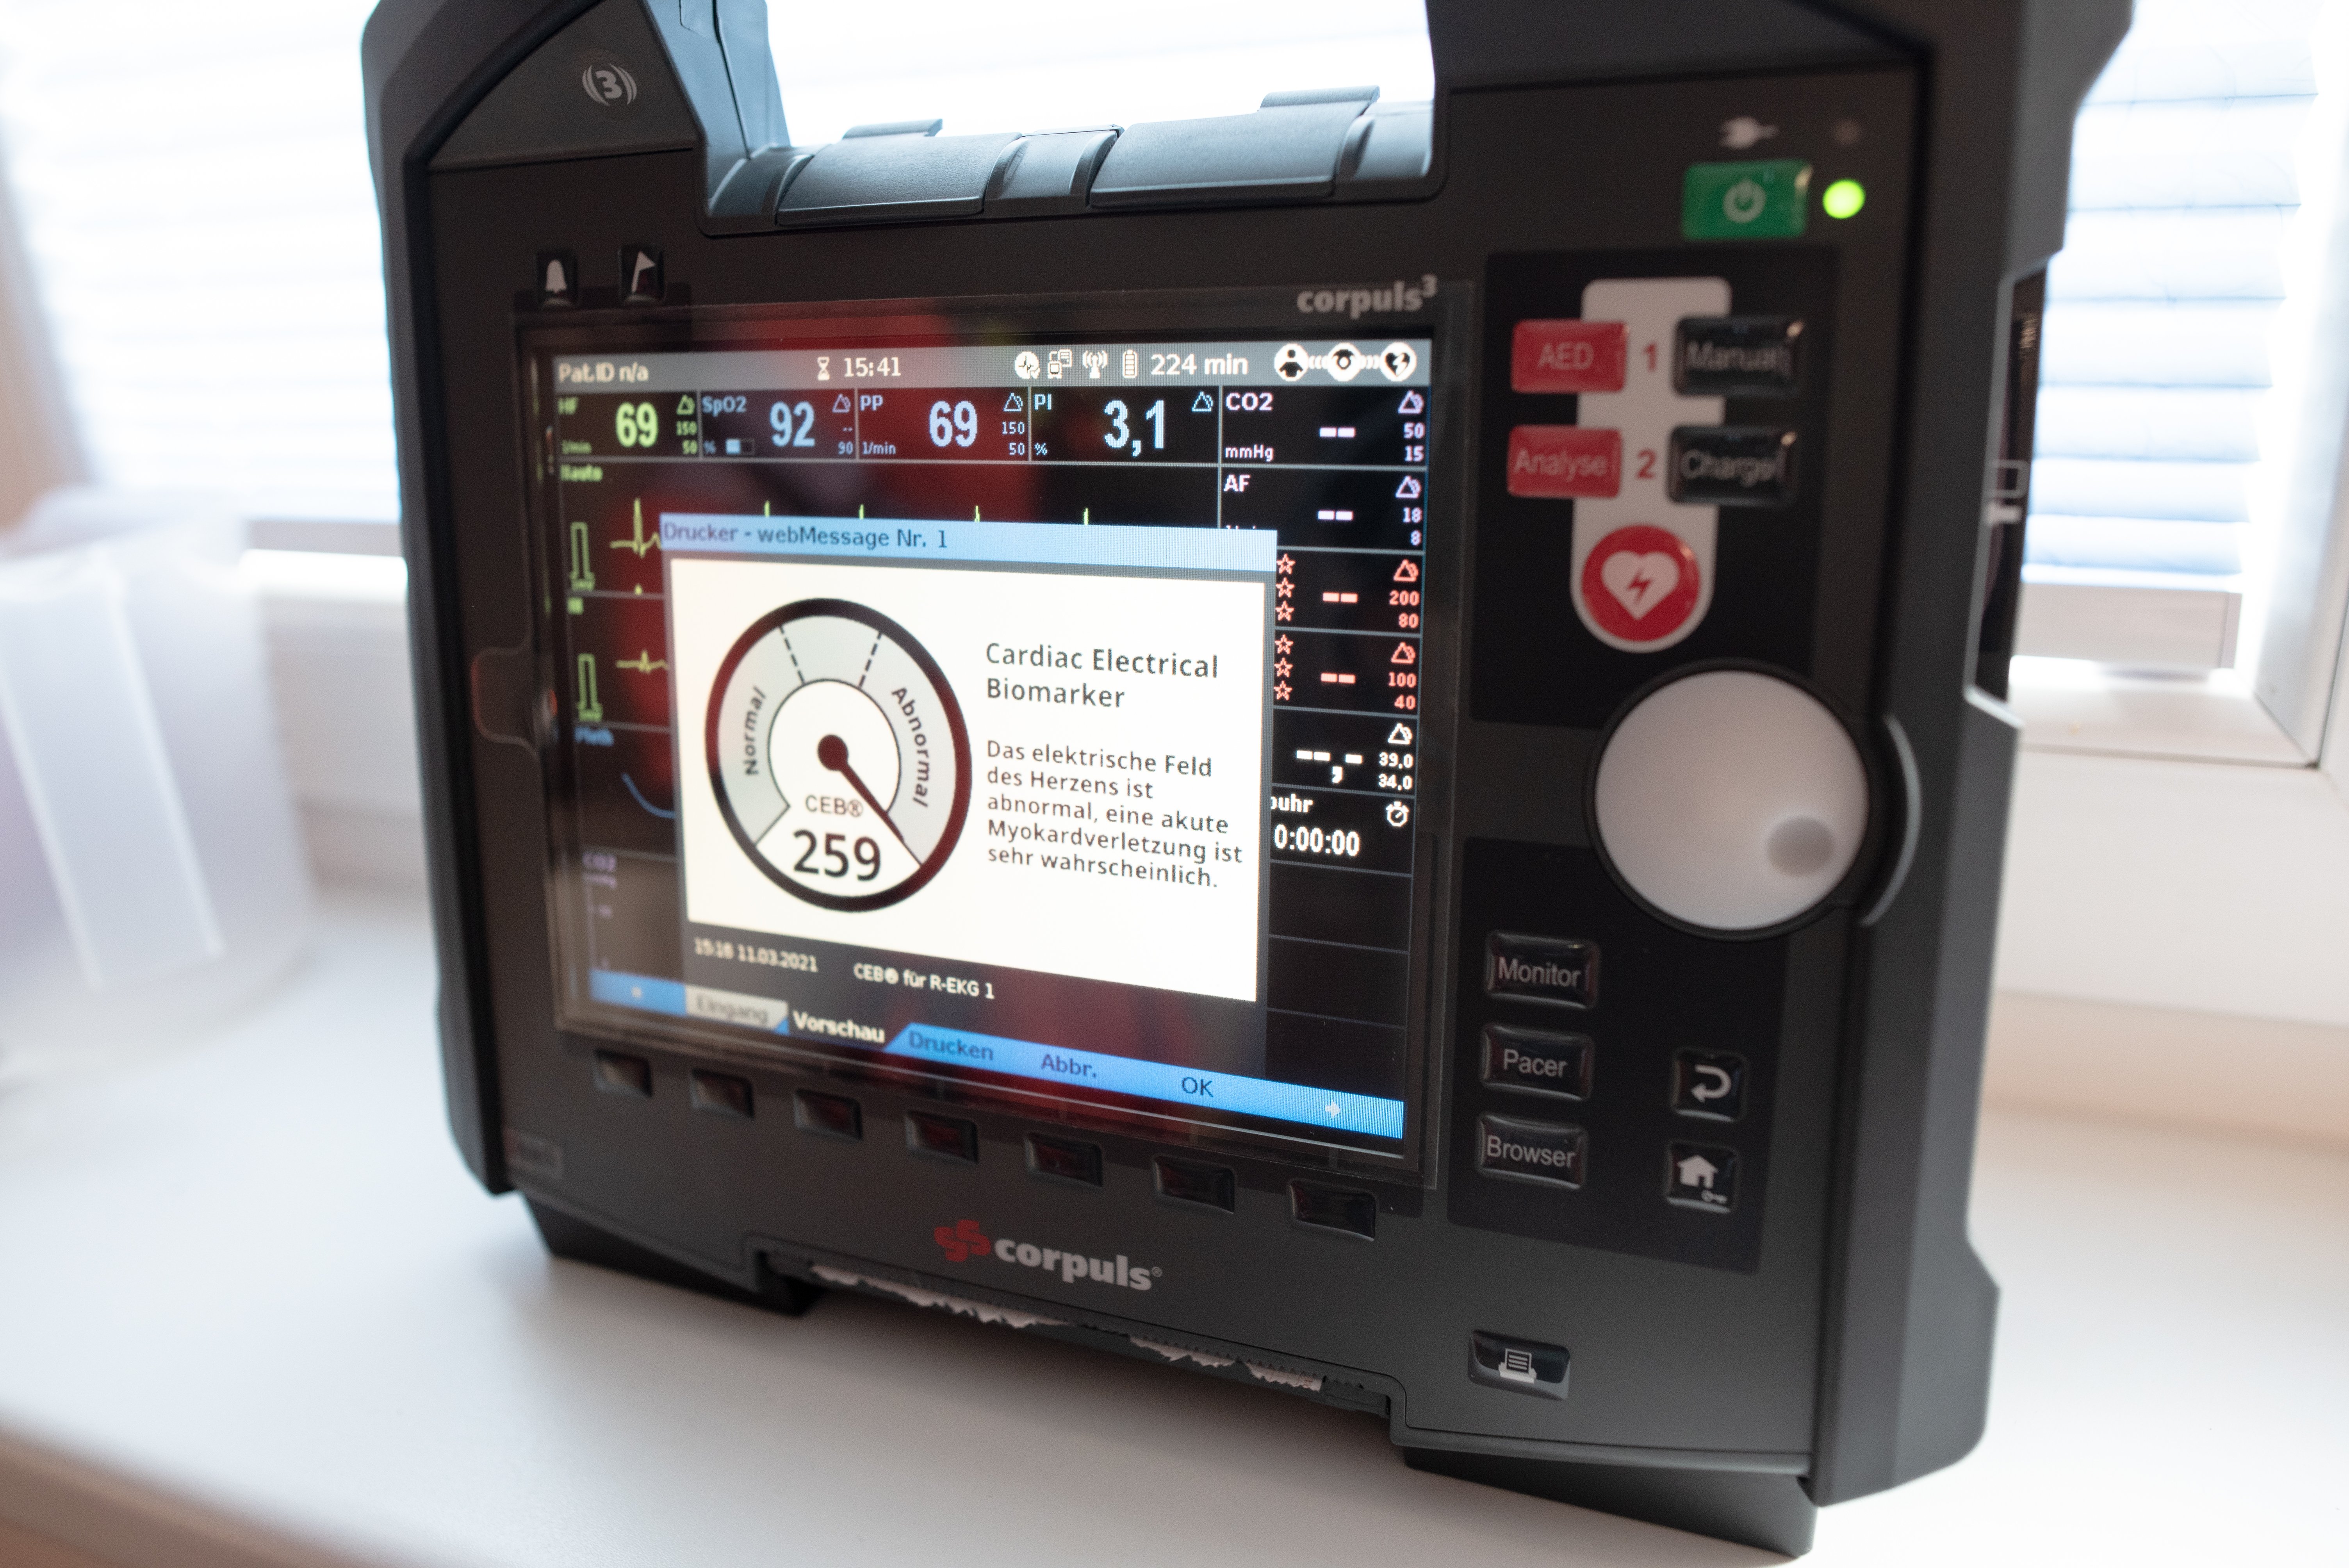
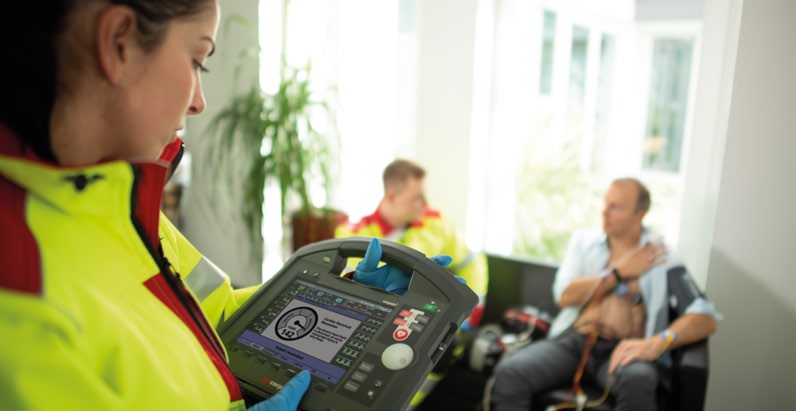
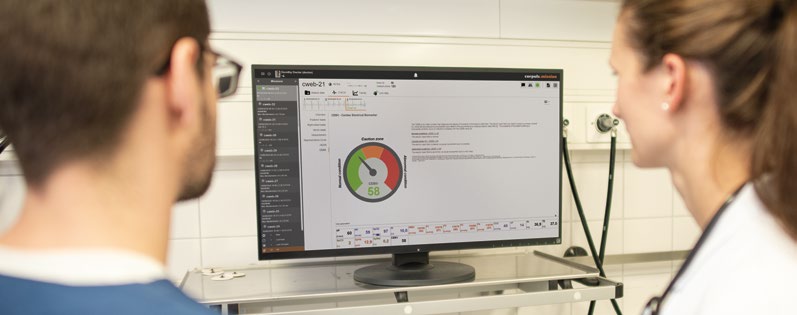
In addition, ECGmax can calculate the Cardiac Electrical Biomarker CEB® from the same electrodes. The three colour-coded areas of the CEB® – normal, conspicuous, abnormal – make interpretation particularly easy. The user can immediately recognise whether myocardial ischemia is present – with comparable sensitivity and specificity to troponin.
• Simple interpretation based on a "traffic light" concept.
• Correlation of the CEB® with troponin.
• No additional electrodes required.
• Non-invasive measurement.
• Continuously measured value.
• High sensitivity and specificity.
• Rapid response through measurement of the electrical field.
ECG Print Outs
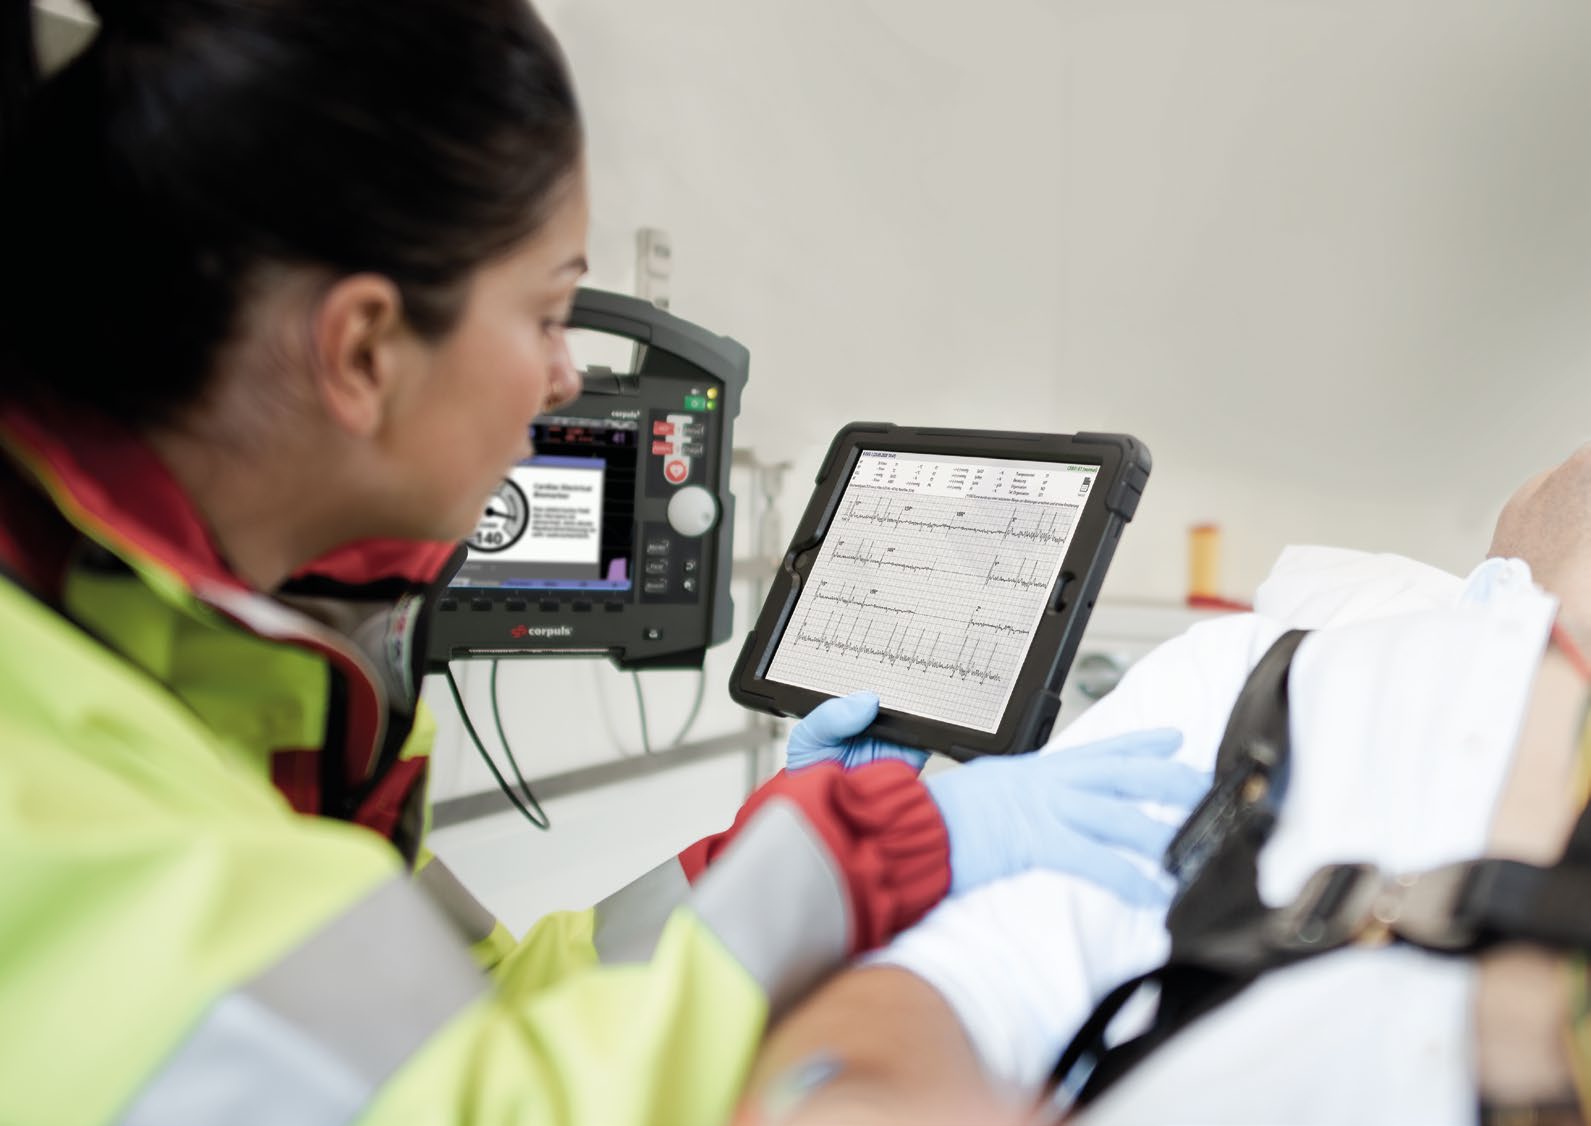
The following files show a resting ECG with 22 leads and the CEB®, in the available formats "Printer optimised", "Lead sections" and "Complete leads", each in the classic order. Of course, ordering according to “Cabrera” is also possible.

STUDIES DEMONSTRATE A CORRELATION BETWEEN TROPONIN AND CEB®
INNOVATION IN MYOCARDIAL INFARCTION DIAGNOSTICS WITH THE CORPULS3
In the event of an acute myocardial infarction, early detection is crucial. Only then it is possible to treat it quickly, which clearly enhances the patient's chances of recovery and survival. Measurement of cardiac troponin is indicated for the diagnosis of an AMI. The diagnosis is confirmed if the value of this biomarker changes either during the initial measurement or the retesting 3 and 6 hours later. In contrast to cardiac troponin, the CEB® cardiac electrical biomarker can be collected without needing to draw blood or process the sample in a lab. Instead, the CEB® can be calculate based on a 12-lead ECG with eigenvalue modelling and quantification from dipolar to multipolar forces. To demonstrate the correlation between CEB® and high-sensitive troponin I (HsTnI), Tereshchenko et al. conducted an extensive investigation. 12-lead ECGs were run on 411 patients and troponin was measured upon admission to hospital and after 3, 6 and 9 hours. The CEB® was determined by using a Vectraplex ECG system (VectraCor, Totowa, NJ).
In a linear, mixed-effects regression analysis, statistically adjusted for the effects of age, ancestry and gender, rising troponin values were associated with significantly increasing CEB® values (95% Confidence Interval, 0.008–0.134; P = 0.027). A tenfold increase in troponin was associated with an 8.3% increase in CEB®. A significant advantage of CEB® is the far easier quantification of myocardial damage by means of an ECG as opposed to blood concentration values. The user friendliness, modest cost, wide availability and continuous monitoring capability of ECGs in emergency medicine encouraged corpuls to offer CEB® immediately with the corpuls3 as an optional solution for easy optimisation of myocardial infarction diagnostics.
IN SUMMARY...
...in examined patients with suspected acute myocardial infarction, a significant correlation was found between the measured level of troponin and the calculated CEB®. This explains why the change in CEB® can be attributed to the underlying damage to the myocardial tissue.
Summary based on: Tereshchenko, Larisa G.; Gatz, David; Feeny, Albert; Korley, Frederick K. (2014): Automated analysis of the 12-lead ECG in the emergency department. Association between high-sensitivity cardiac troponin I and the cardiac electrical biomarker. in: Critical Pathways in Cardiology 13(1), pp. 25–28. DOI: 10.1097 HPC.0000000000000006.
Learn more about our products
corpuls simulation
Train to be the best with corpuls simulation. Control the physiological signals, vital parameters and scenarios presented to your trainees, providing the most realistic training available. Review performance data and guide improvements. Being the best is in your control.
The corpuls simulation device has bluetooth capability, allowing you to easily connect to the cpr arm, meaning synchronised therapy can be trained realistically at any time.
With the corpuls simulation COMMUNITY, you're also able to collaborate with colleagues around the globe, sharing scenarios, data and performance metrics. The result is a team that is optimally prepared for every scenario and therefore, a significantly better quality of care for the future patient.
